Running telemetry locally
Because we are using open telemetry, we can use one telemetry system in production (AWS) and another one locally. More information on why open telemetry was chosen is available in this ADR.
Running jaeger + grafana + prometheus locally turns out to be easy.
Setup
In one terminal window run
make telemetry_dockerIn another, run
TELEMETRY_ENDPOINT=localhost:4317 TELEMETRY_ENABLED=1 make server_runVisit http://localhost:16686
To start collecting information you must run the mymove app locally. To do this navigate to the mymove repo and run the command
make client_runto start up the local server. You can then navigate through the app to start collecting data.
Note that the milmove server only exports data periodically, so you may need to way up to a minute for the results to show
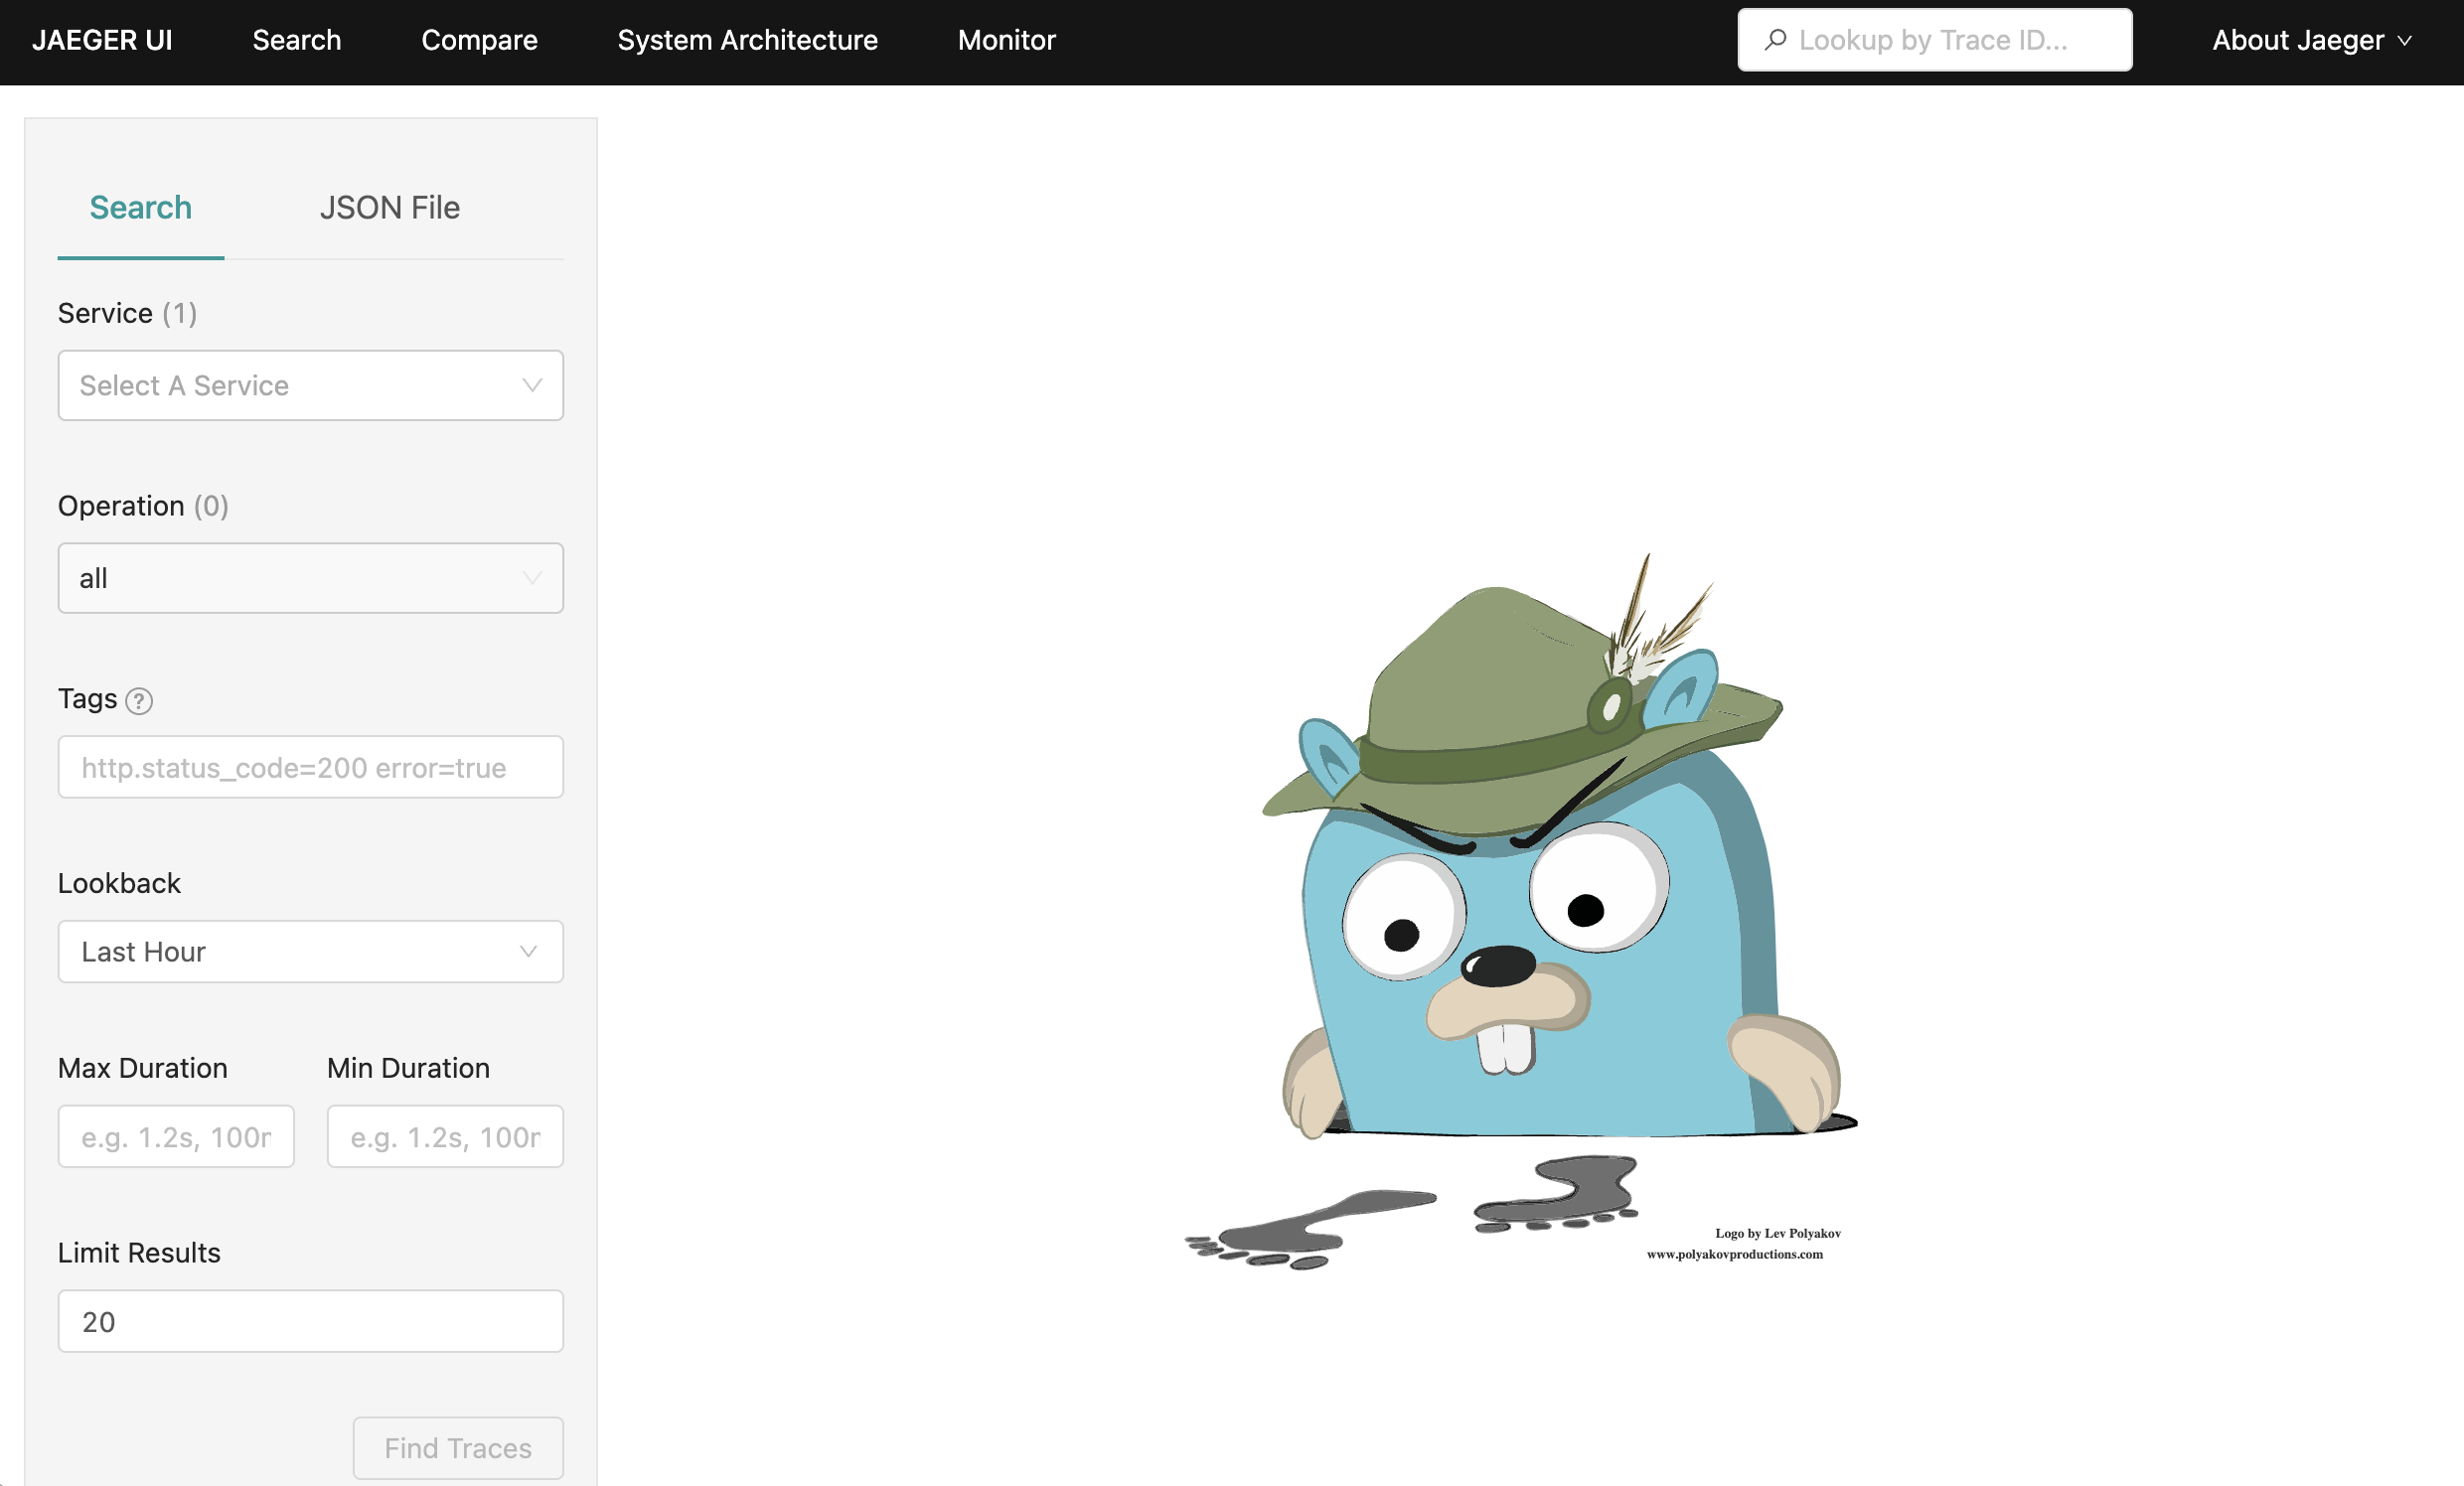
To view this data, on the Jaeger page you can click the
Servicedropdown and then click on themilmoveservice.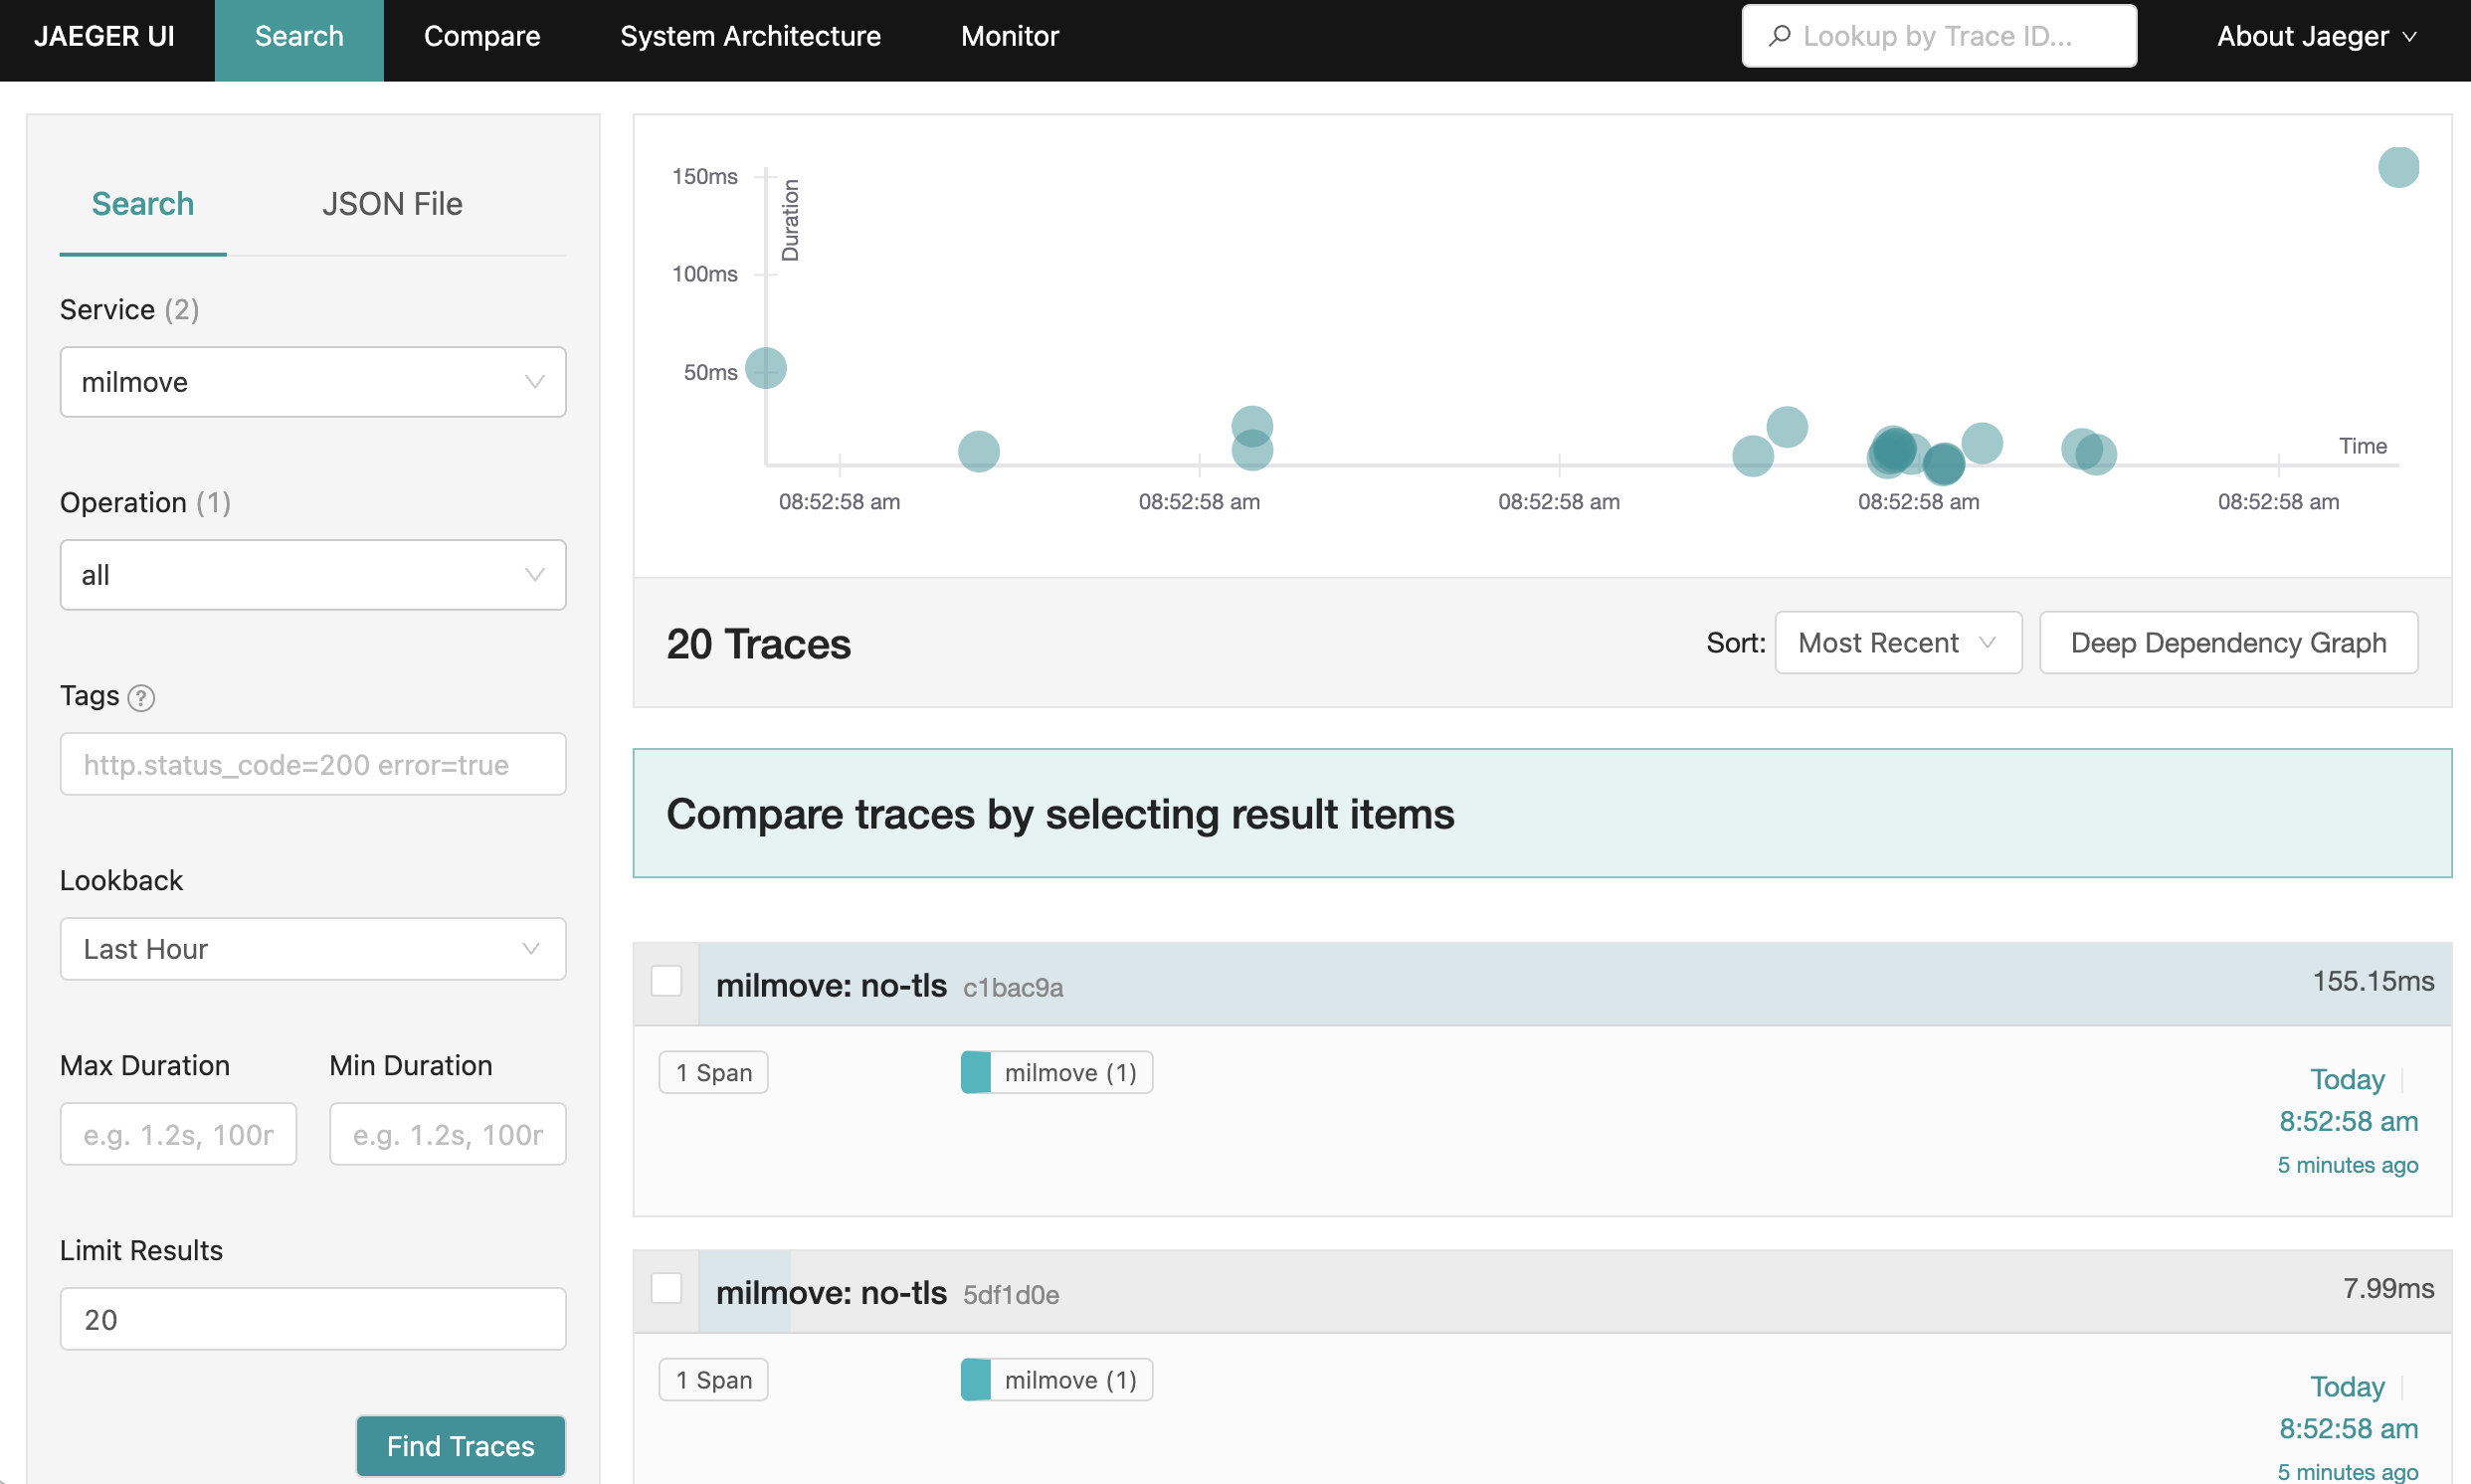
Viewing Metrics
You can view metrics in grafana
Visit http://localhost:3333
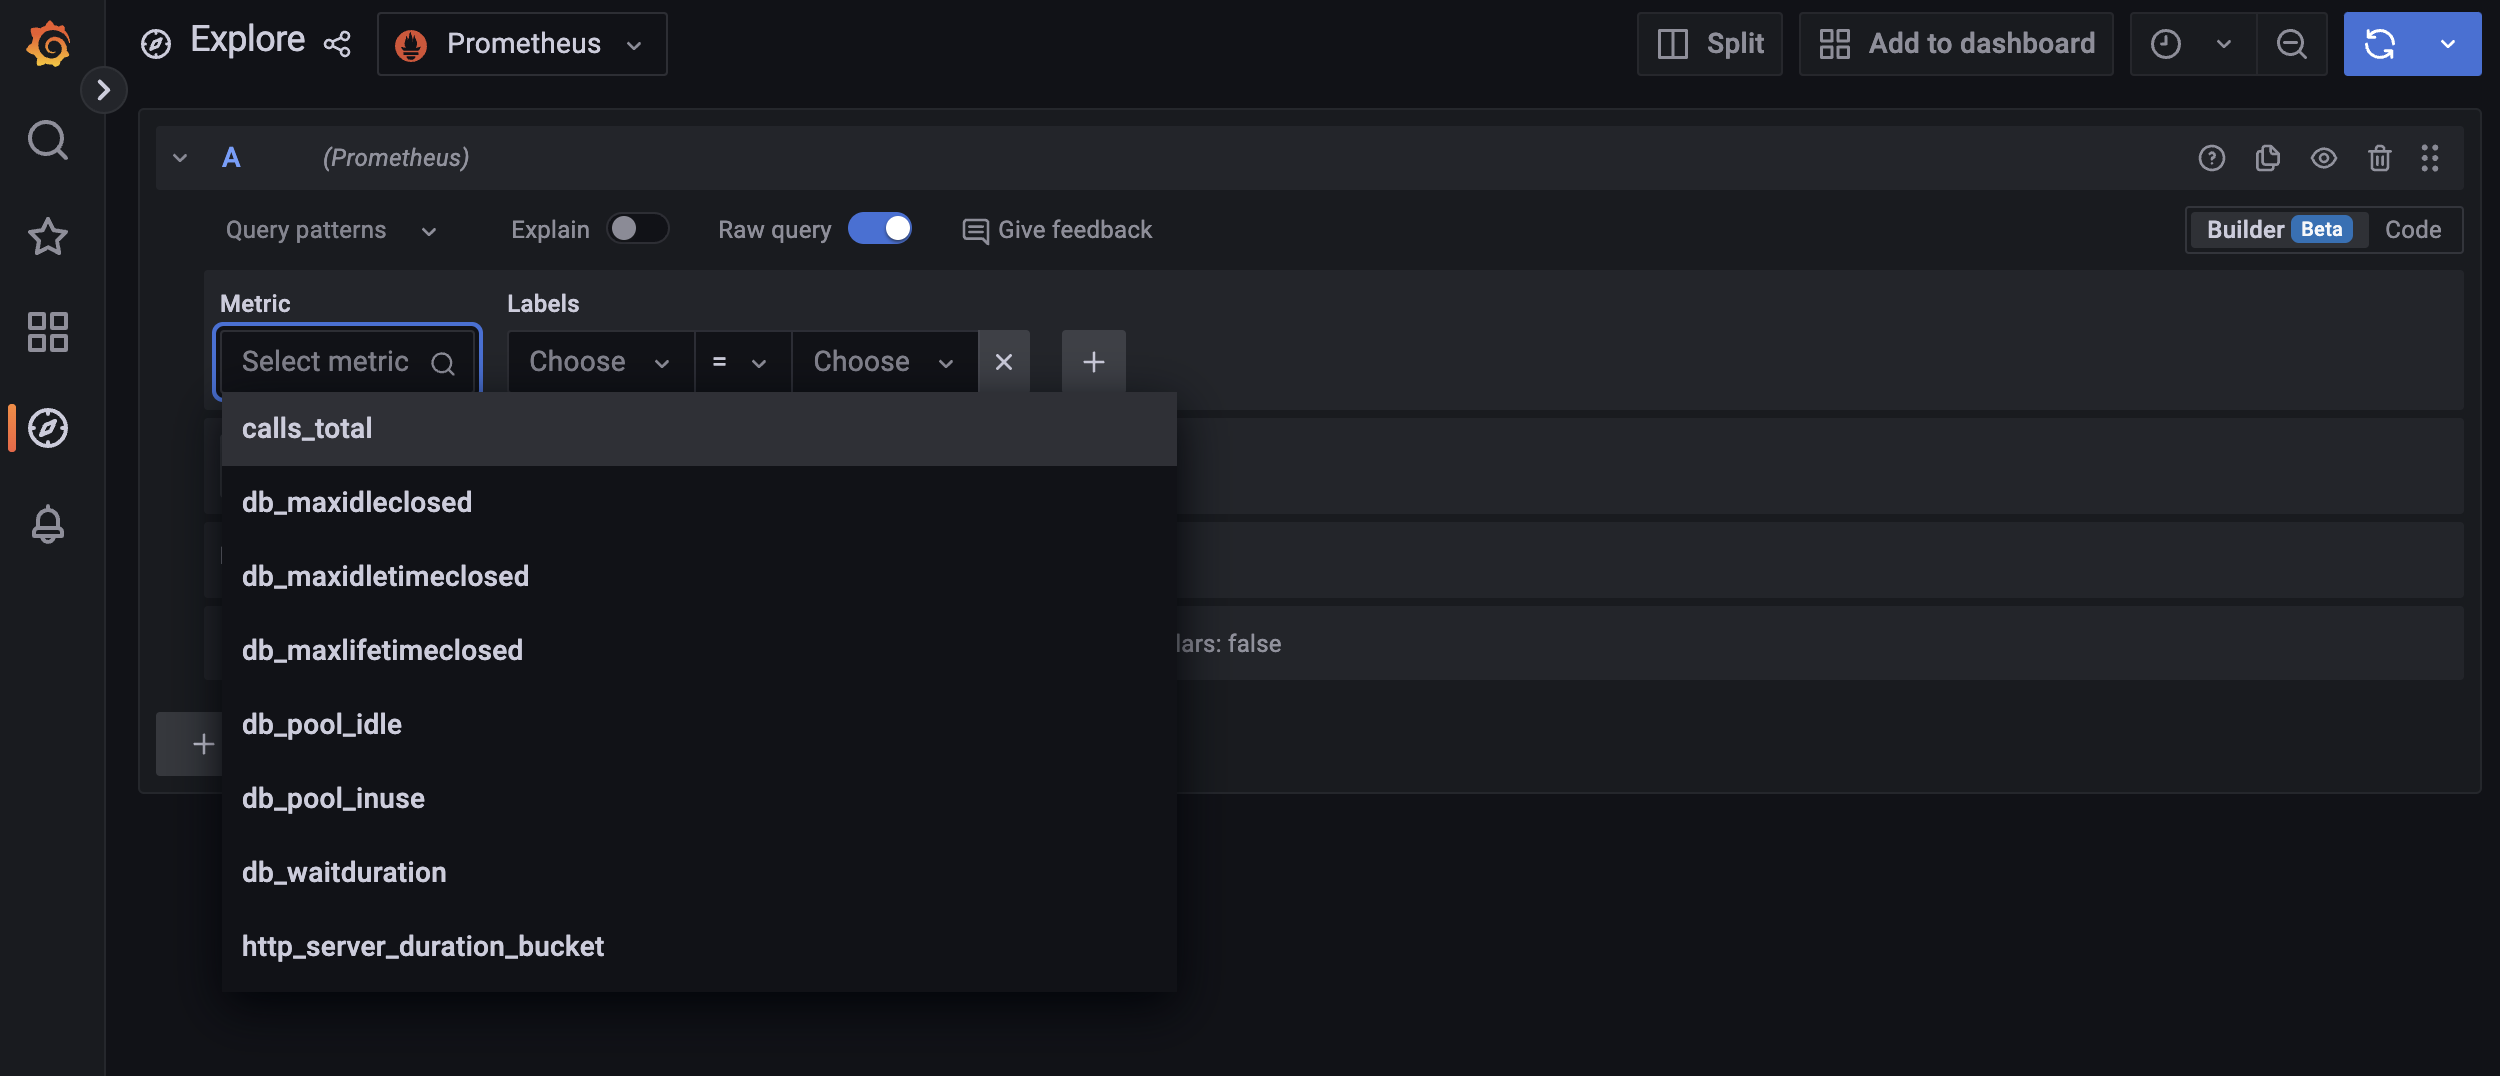
Select the Explore icon (it looks like a compass)
Select the metric to view
How to find specific transactions
To find specific transactions you can filter by tags associated with each span.
Here are a list of some of the tags that you can search against and what information is provided in that field:
| Key | Description | Example |
|---|---|---|
| http.route | Shows the non dynamic url that is hit | /internal/service_members/{serviceMemberId} |
| http.status_code | Show the corresponding http status code | 200 |
| http.method | Shows the http request method | PATCH |
Troubleshooting
This is a list of common errors that you might see and what they mean:
context deadline exceeded this is an indication that it can't reach the telemetry server.